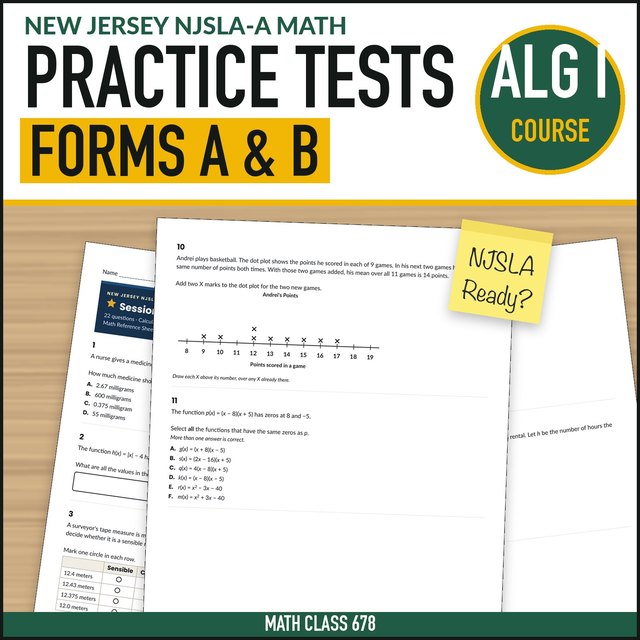
New Jersey NJSLA Algebra I Practice
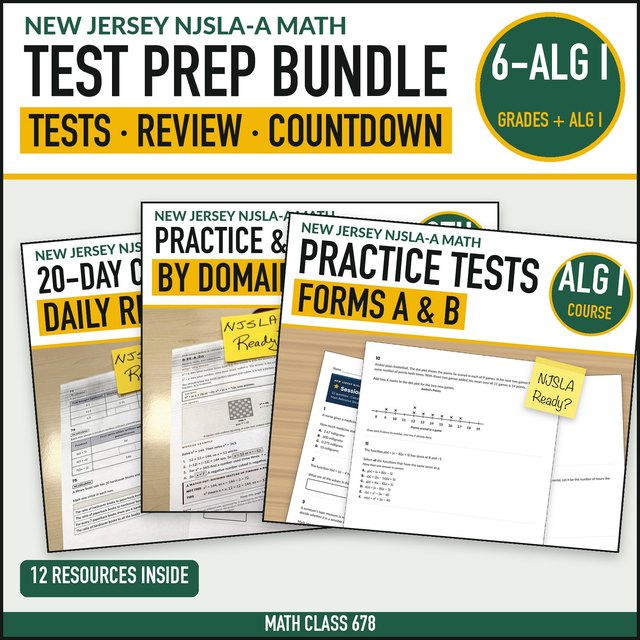
Algebra I practice covers the 36 standards of New Jersey’s Algebra 1 course, in the NJSLA-A end-of-course test’s three reporting categories: Number and Quantity and Algebra; Functions; and Statistics and Probability. The test has 43 items in two sessions of about 75 minutes, in multiple choice, multi-select, response boxes, tables and graphic answers. A graphing calculator is allowed throughout.
 Designed, reviewed, and checked by Greg · 25+ years in the classroom · Updated for 2026-27
36standards
3reporting categories
370pages
Free Start with the free Algebra I screener: 15 questions and a table that says which reporting category each student needs first.
Your testing year
Where each part fits in the 2026-27 school year.
- 1Practice and reteach by domainas you teach it
- 2Practice Test Form Amidyear, scored by category
- 320-day countdownthe last 20 school days
- 4Practice Test Form Bjust before the test
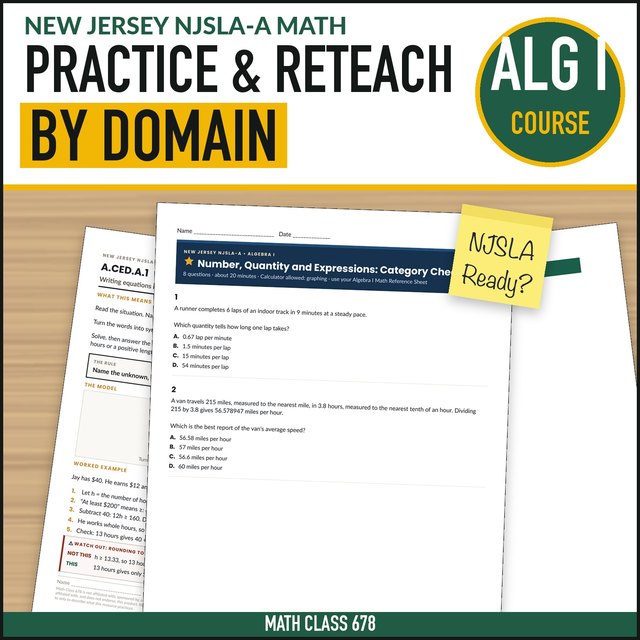
Practice & Reteach by Domain
237 pages · 36 standardsView on TPT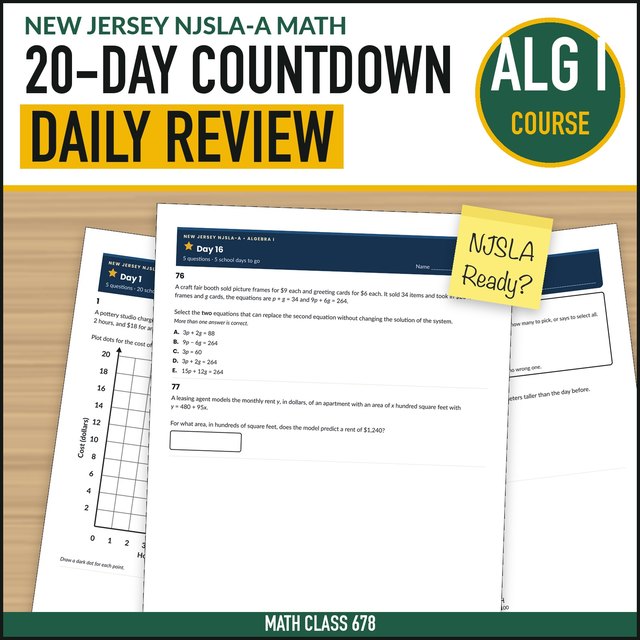
20-Day Countdown Review
100 items · 67 pagesView on TPTSave with a bundle
See inside the Algebra I practice
Press play for a 20-second look at the real pages.
How the Algebra I test is weighted
The number of items in each reporting category on the Algebra I NJSLA-A, from New Jersey’s published math blueprint.
Number and Quantity and Algebra
15–18 of 43 items
Functions
15–18 of 43 items
Statistics and Probability
10–12 of 43 items
What Algebra I covers
Short names in our own words. See New Jersey’s high school mathematics course content for the official standard text.
Number, Quantity and Expressions
- N.Q.A.1Units and quantities
- N.Q.A.3Choosing a level of accuracy
- A.SSE.A.1Interpreting expressions
- A.SSE.B.3Equivalent forms of expressions
Equations and Inequalities
- A.CED.A.1Writing equations in one variable
- A.CED.A.2Writing equations in two variables
- A.CED.A.3Constraints
- A.CED.A.4Rearranging formulas
- A.REI.A.1Explaining solution steps
- A.REI.B.3Linear equations and inequalities
- A.REI.B.4Solving quadratic equations
- A.REI.C.6Systems of linear equations
- A.REI.D.11Solving equations with graphs
- A.REI.D.12Graphing linear inequalities
Interpreting Functions
- F.IF.A.1Functions, domain and range
- F.IF.A.2Function notation
- F.IF.A.3Sequences as functions
- F.IF.B.4Key features of graphs and tables
- F.IF.B.5Domain in context
- F.IF.B.6Average rate of change
- F.IF.C.7Graphing functions
- F.IF.C.8Forms of a quadratic function
- F.IF.C.9Comparing functions
Building and Comparing Functions
- F.BF.A.1Writing functions
- F.BF.B.3Transforming graphs
- F.LE.A.1Linear or exponential
- F.LE.A.2Building linear and exponential models
- F.LE.A.3Exponential growth overtakes
- F.LE.B.5Interpreting parameters
Statistics and Probability
- S.ID.A.1Data displays
- S.ID.A.2Comparing center and spread
- S.ID.A.3Shape, center, spread and outliers
- S.ID.B.6Scatter plots, models and residuals
- S.ID.C.7Slope and intercept in context
- S.ID.C.8Correlation coefficient
- S.ID.C.9Correlation and causation
Try two items
Pick an answer to see the worked solution.
Which statement about the graph of f(x) = 5(2)x is true?
Choose an answer to see the worked solution.
Worked solutionAt x = 0 the power of 2 is 1, so f(0) = 5 and the graph crosses the y-axis at (0, 5). Every value of 5(2)x is positive, so the graph never reaches the x-axis. The 2 is the base, not the y-intercept. The graph does not cross the x-axis at (−5, 0), because f(−5) is 5 ÷ 32. The y-intercept is not 10, and since the base is greater than 1 the graph rises from left to right.
Which function changes by the same percent every time x increases by 1?
Choose an answer to see the worked solution.
Worked solutionA constant percent rate means the output is multiplied by the same factor each time x goes up by 1. In f(x) = 300(1.08)x every output is 1.08 times the one before, an 8% increase. The two functions of the form 300 + (a number)x add the same amount each step, so they are linear. The function 8x2 + 300 gives 300, 308, 332, 372: the increases 8, 24 and 40 are not equal, and neither are the factors.
Teacher questions
When should I use each part?
Assign each practice set as you teach its topics, then give the full-length practice test once everything has been taught.
What about calculators?
The practice follows the state's calculator rule for this course: a graphing calculator for the whole test. Check your school's testing guidance for the current rules.
Are these actual state test questions?
No. Every item is original and aligned to the published standards. Nothing is copied from a state test, a released item or a reference sheet.
Other New Jersey grades and courses
Independent practiceIndependent practice for the New Jersey Student Learning Assessment (NJSLA) in mathematics. Not affiliated with, sponsored by, or endorsed by the New Jersey Department of Education. Standard names on this page are short summaries in our own words.